OpenAI
This is my cat, Mr. Wiggles, and this is the story of how OpenAI’s AI models and NVIDIA-based 3D sensing helped guide a timely, life-saving medical decision when it mattered most.
This is my cat, Mr. Wiggles, and this is the story of how OpenAI’s AI models and NVIDIA-based 3D sensing helped guide a timely, life-saving medical decision when it mattered most.

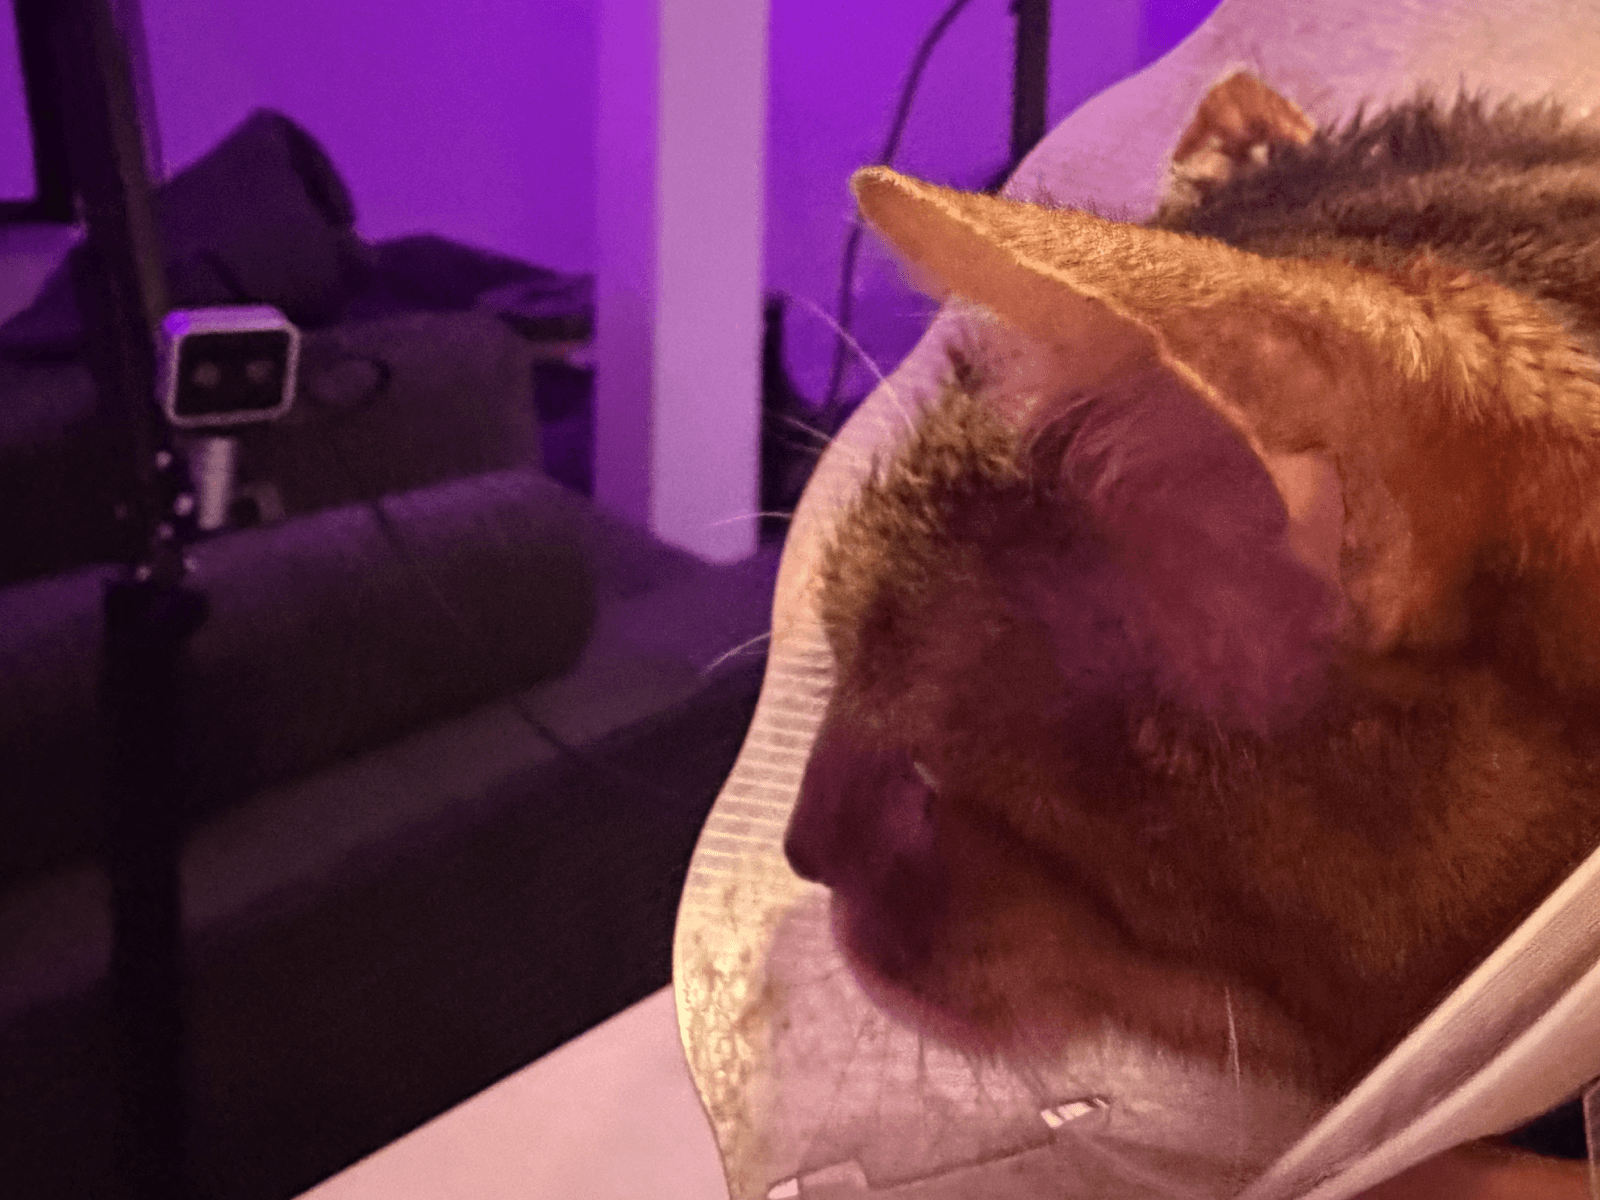
Mr. Wiggles, an 11-year-old Bengal (with a typical lifespan of ~20–22 years), developed sudden, balloon-like swelling in one ear that was first noticed by my wife.
Mr. Wiggles, an 11-year-old Bengal (with a typical lifespan of ~20–22 years), developed sudden, balloon-like swelling in one ear that was first noticed by my wife.

I began documenting the condition with daily images and used AI-assisted visual comparison to identify likely causes; early evidence pointed to an aural hematoma—a fluid-filled swelling with multiple possible etiologies (trauma, irritation, or genetics).
A mobile veterinarian prescribed topical treatment, but after ~15 days with no improvement, the swelling continued to progress, contradicting expected recovery patterns.
For the first 5 days, I relied on 2D images (1200×1200 px), which proved insufficient—without bulge height, surface area, or volume, it was impossible to quantify severity or progression.
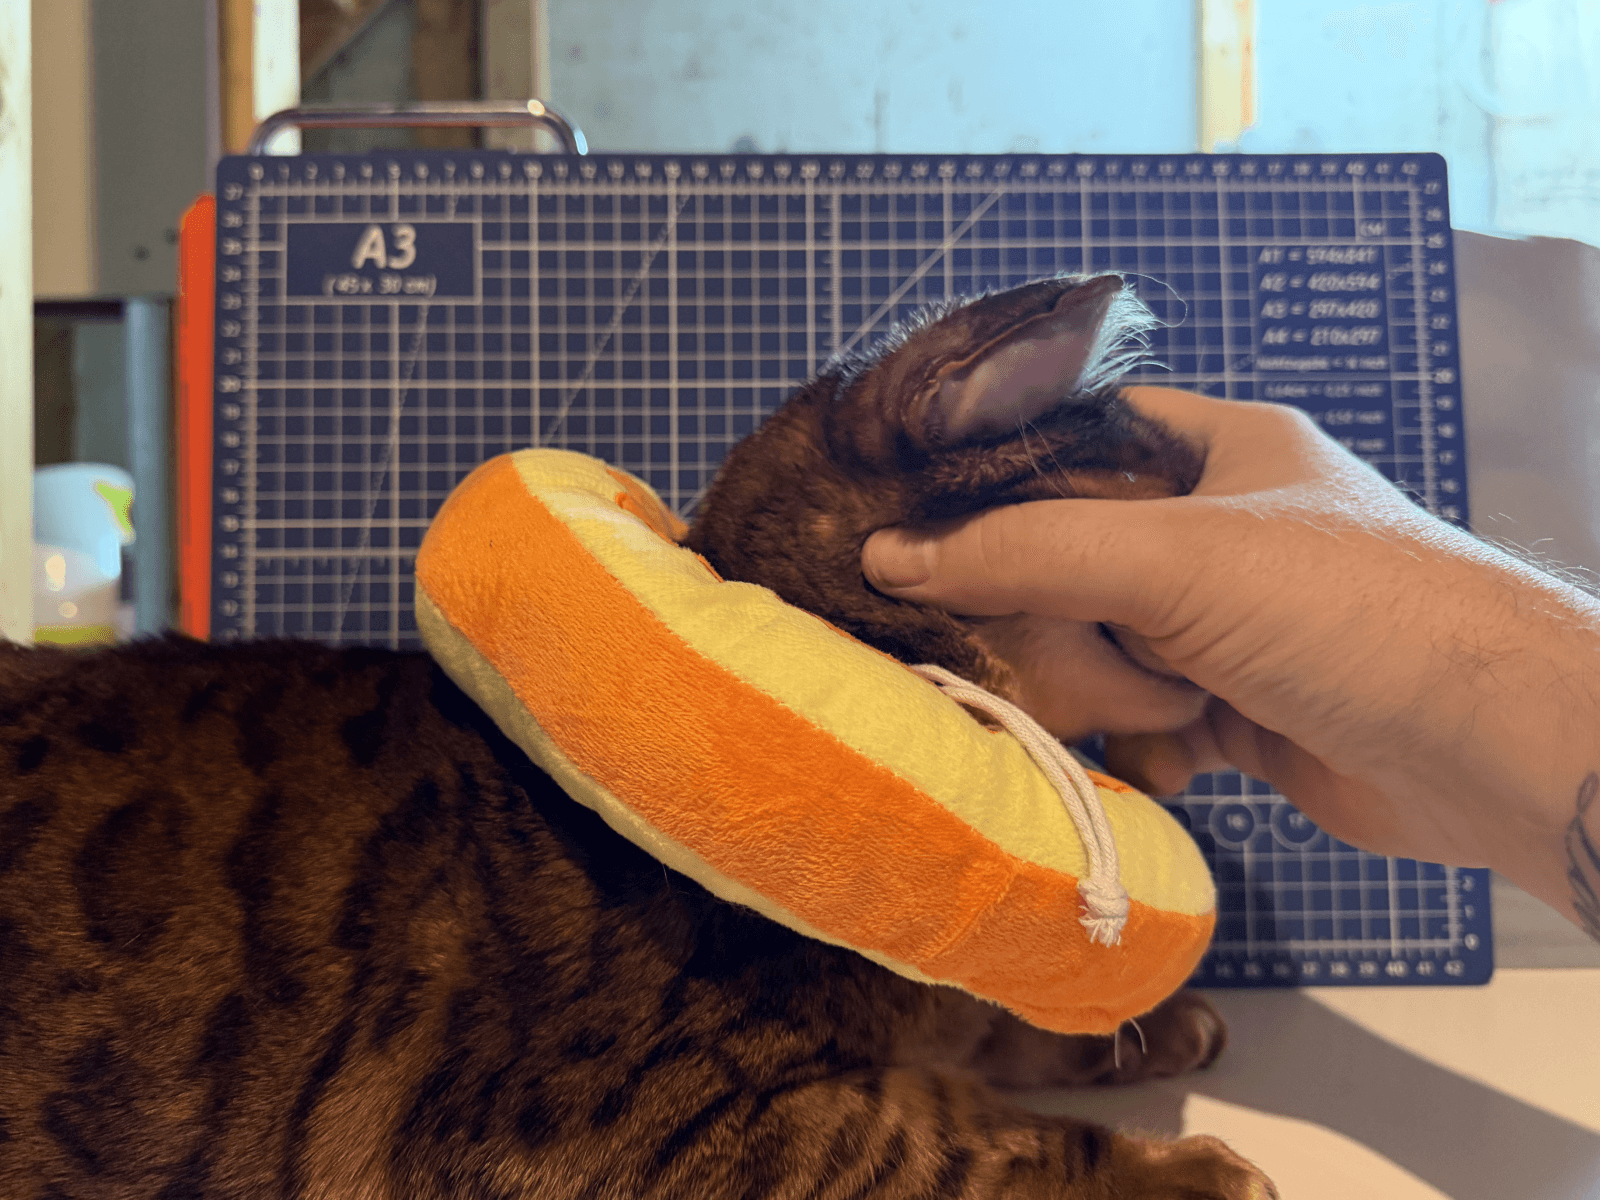
Drawing on my background as a CS PhD in AI and robotics, I built a homemade RGB-D diagnostic setup using an Intel RealSense D405, collecting a 10-day 3D time-series dataset that measured ear bulge height and estimated volume growth over time.
I began documenting the condition with daily images and used AI-assisted visual comparison to identify likely causes; early evidence pointed to an aural hematoma—a fluid-filled swelling with multiple possible etiologies (trauma, irritation, or genetics).
A mobile veterinarian prescribed topical treatment, but after ~15 days with no improvement, the swelling continued to progress, contradicting expected recovery patterns.
For the first 5 days, I relied on 2D images (1200×1200 px), which proved insufficient—without bulge height, surface area, or volume, it was impossible to quantify severity or progression.
Drawing on my background as a CS PhD in AI and robotics, I built a homemade RGB-D diagnostic setup using an Intel RealSense D405, collecting a 10-day 3D time-series dataset that measured ear bulge height and estimated volume growth over time.

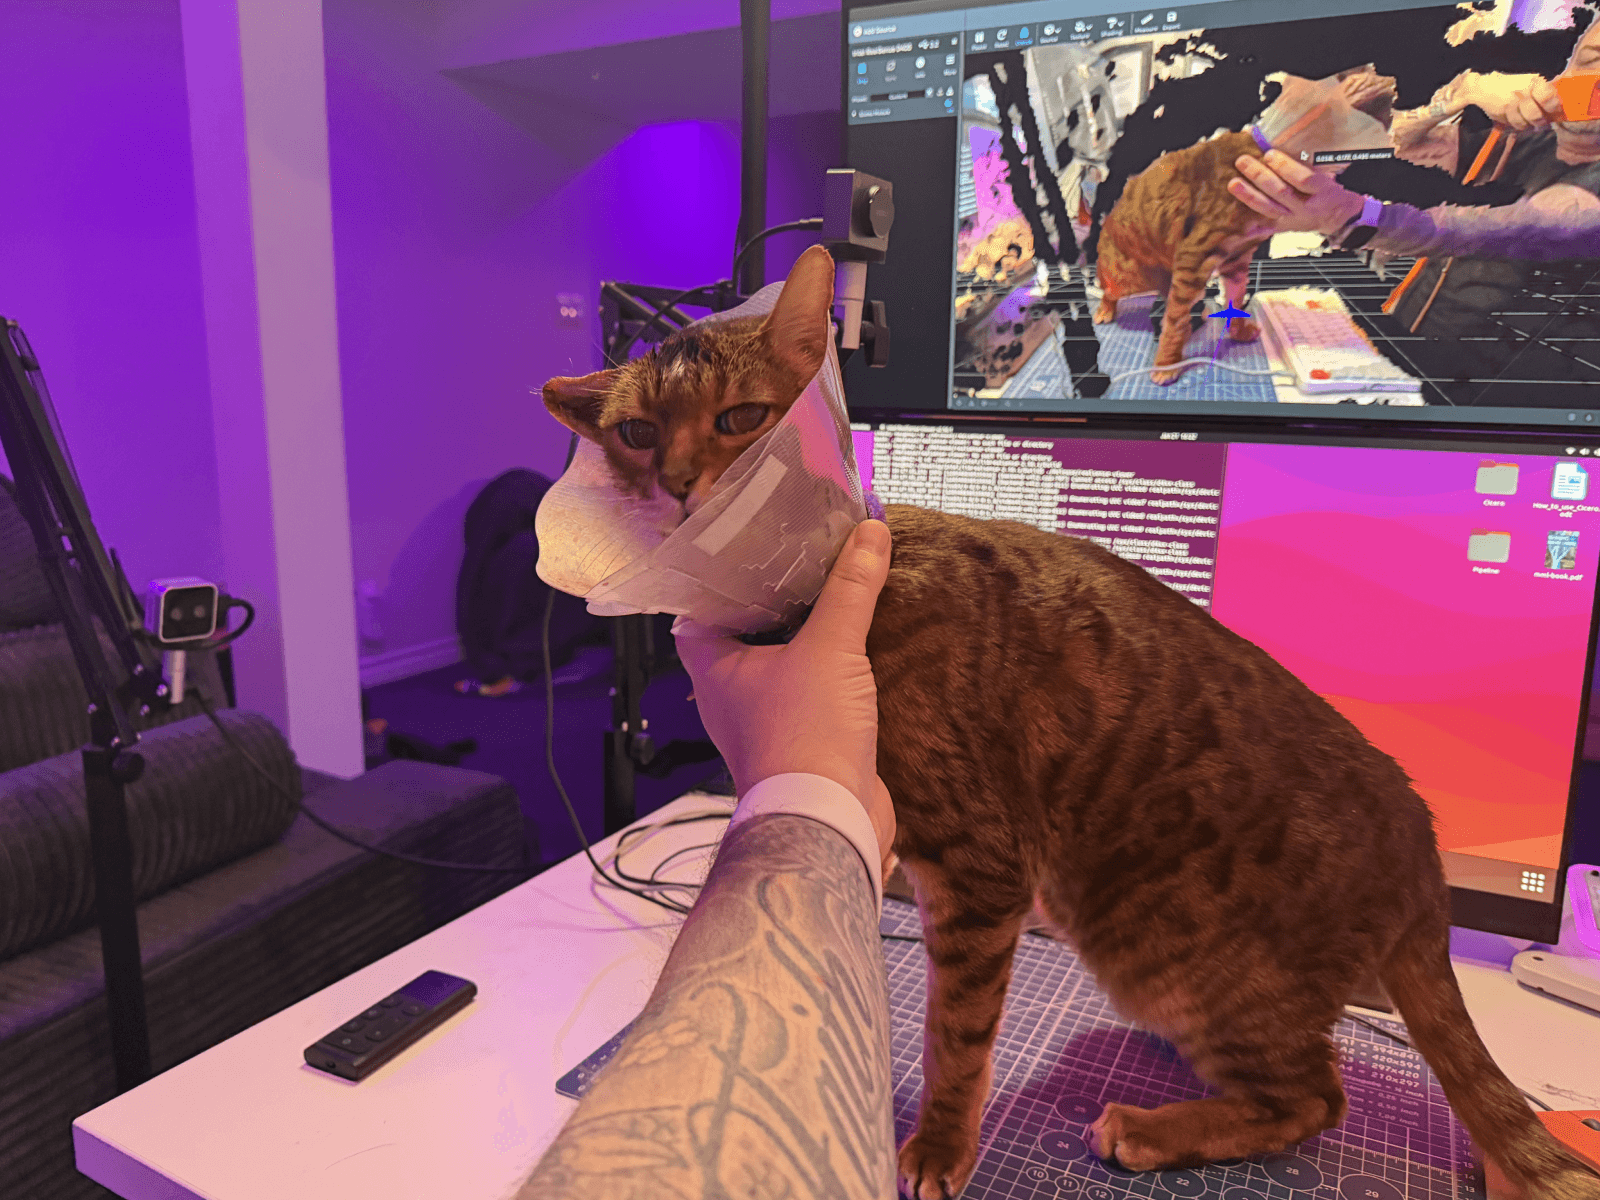
I manually positioned my cat during each capture session and recorded a time-series of localized ear geometry, extracting quantitative measures of bulge height, surface area, and estimated volume over time.
This workflow produces a 15-day 3D time-series dataset that turns ear swelling from a subjective visual observation into a measurable signal. Each day, localized ear geometry is reconstructed as a noisy but biologically realistic bulge, allowing peak bulge height, estimated surface area, and volumetric growth to be extracted directly from the point cloud.
The growth follows a non-linear trajectory with day-to-day variability, reflecting real inflammatory dynamics rather than idealized linear change. By tracking both absolute size and rate of change over time, the resulting plots make it possible to identify accelerating swelling that would be difficult to assess from 2D images alone, supporting earlier and more confident intervention decisions.
This video shows the RGB-D data captured during the monitoring process, where color imagery is paired with depth measurements to reconstruct the ear in three dimensions over time. By combining RGB information with per-pixel depth, the dataset makes it possible to visualize not just how the ear looks, but how its geometry changes—revealing subtle increases in bulge height, surface area, and volume that are not apparent in standard 2D video.
To ensure consistency and accurate measurements across days, a fixed-mounted RGB-D camera was used for all captures. Keeping the camera position and distance constant eliminated viewpoint and scale variation, allowing changes in bulge height, surface area, and volume to be attributed to real physiological changes rather than differences in camera placement or perspective.
The bulge height data captures the most immediately visible aspect of the swelling: how far the ear protrudes relative to its normal surface. By extracting a robust peak height from the depth measurements each day, this signal reflects localized changes in ear geometry while reducing sensitivity to noise or single-point outliers. Over time, the height curve shows non-linear growth with small day-to-day fluctuations, mirroring real biological inflammation rather than smooth, idealized expansion. This makes bulge height a useful early indicator of progression, especially when changes are subtle and difficult to judge by eye.
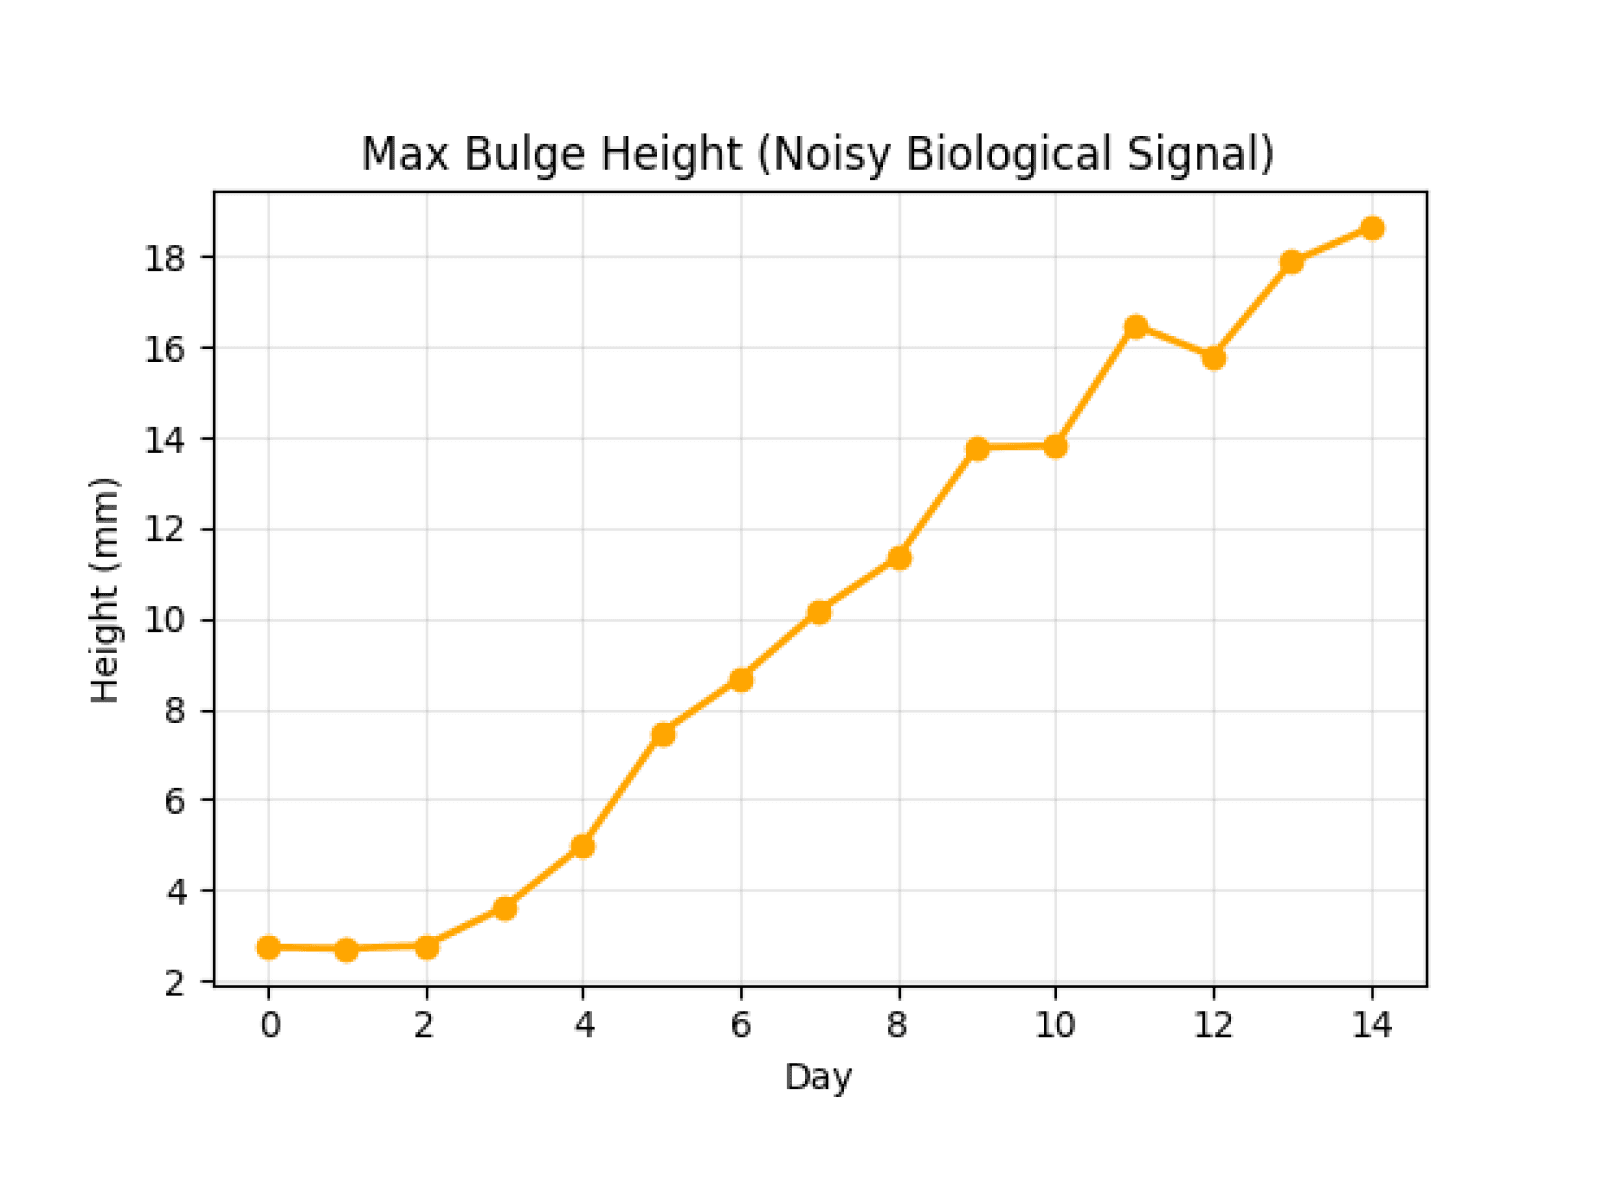
The volume data provides a deeper and more clinically meaningful signal by integrating height changes across the affected area of the ear. Even small increases in bulge height can translate into disproportionately large increases in volume, making volumetric growth especially sensitive to worsening conditions. Tracking volume over time highlights acceleration phases that may not be obvious from height alone, helping distinguish between stable swelling and rapidly progressing pathology. In practice, this volumetric signal is what enables confident escalation decisions, as it captures the overall severity and momentum of the condition rather than a single geometric dimension.
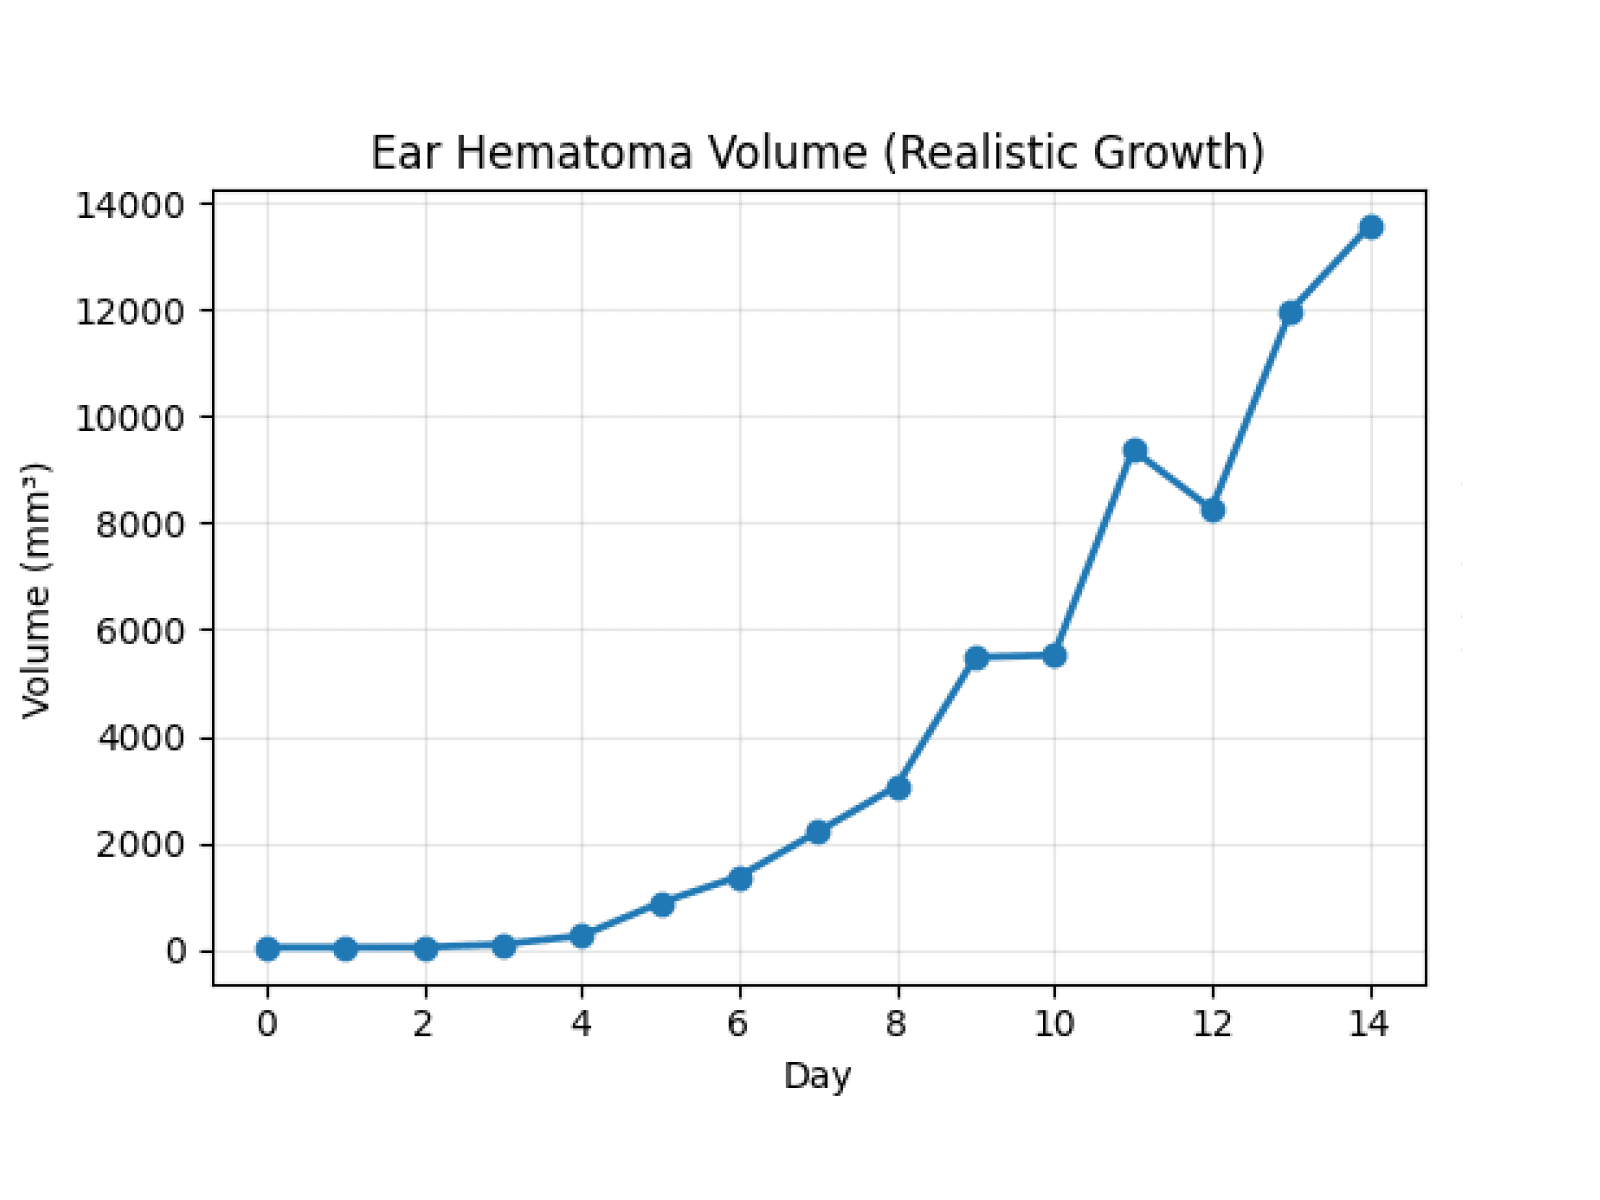
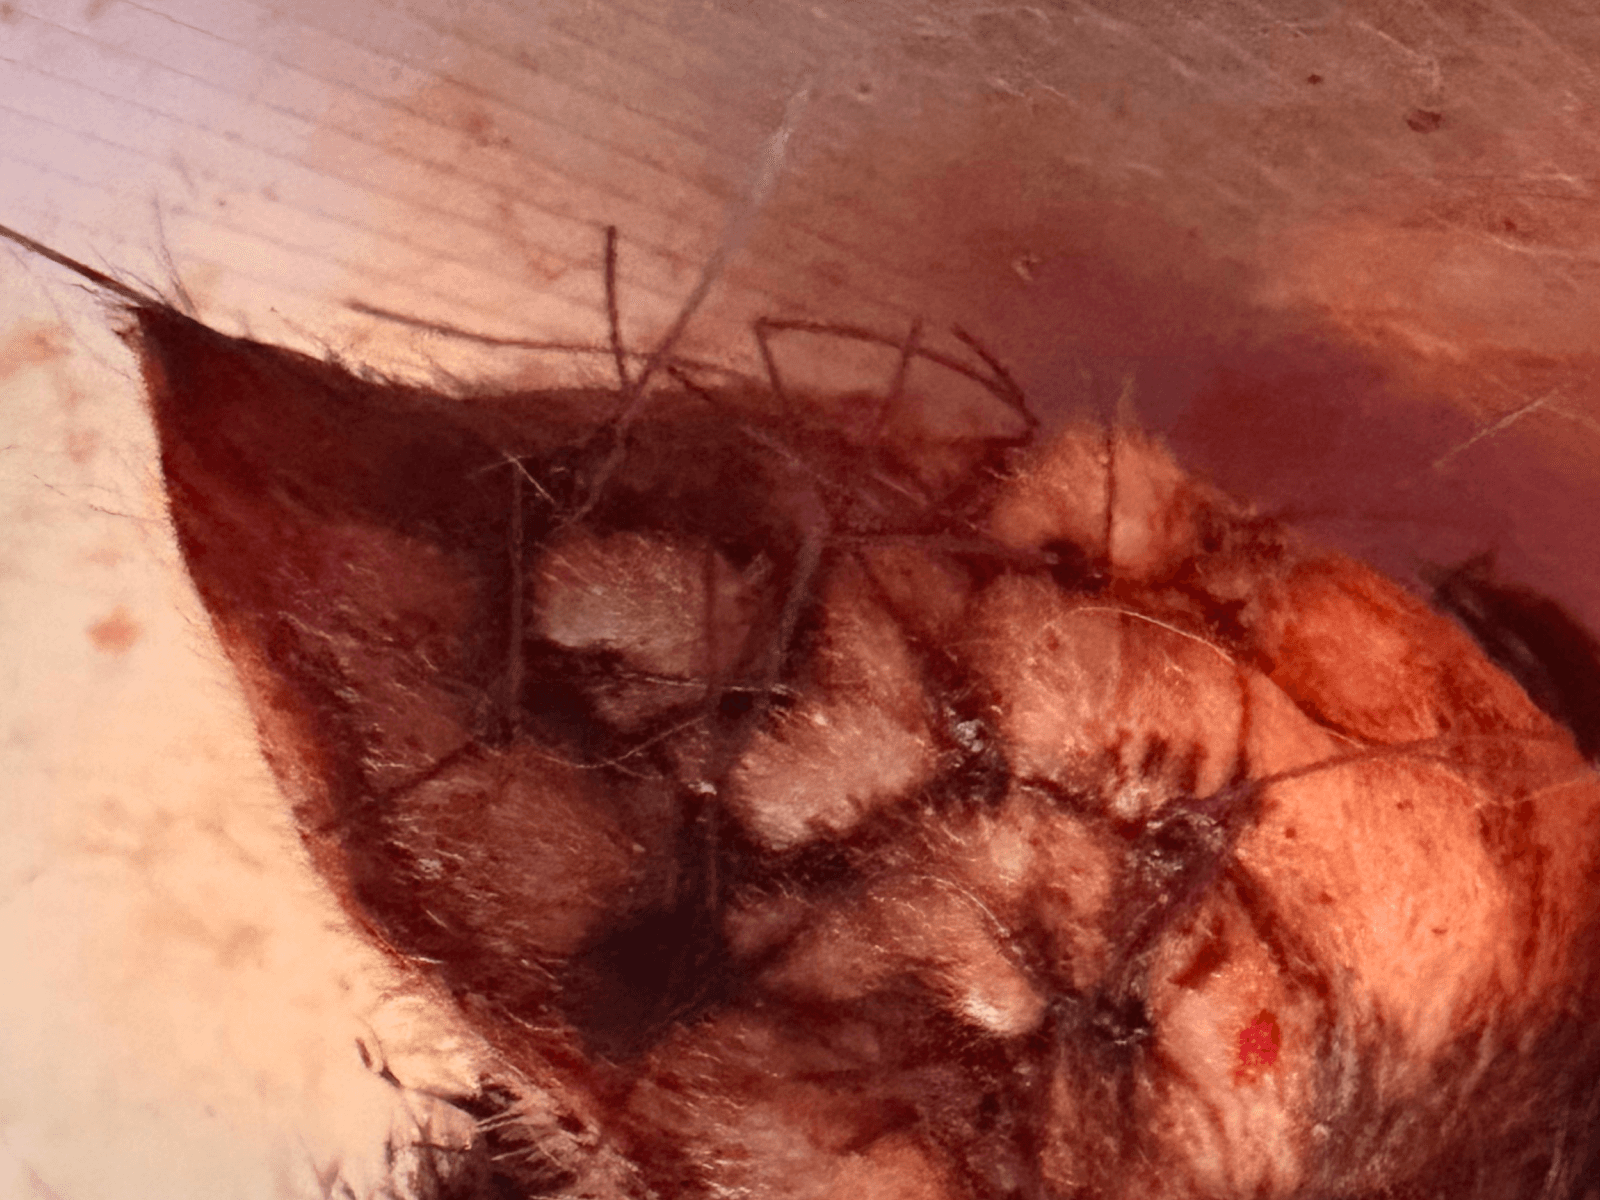
By analyzing non-linear growth and acceleration in volume, an AI agent recommended immediate veterinary intervention on day 13; surgery was performed within hours, and Mr. Wiggles made a full recovery with a normal life expectancy.
The growth follows a non-linear trajectory with day-to-day variability, reflecting real inflammatory dynamics rather than idealized linear change. By tracking both absolute size and rate of change over time, the resulting plots make it possible to identify accelerating swelling that would be difficult to assess from 2D images alone, supporting earlier and more confident intervention decisions.
This video shows the RGB-D data captured during the monitoring process, where color imagery is paired with depth measurements to reconstruct the ear in three dimensions over time. By combining RGB information with per-pixel depth, the dataset makes it possible to visualize not just how the ear looks, but how its geometry changes—revealing subtle increases in bulge height, surface area, and volume that are not apparent in standard 2D video.
To ensure consistency and accurate measurements across days, a fixed-mounted RGB-D camera was used for all captures. Keeping the camera position and distance constant eliminated viewpoint and scale variation, allowing changes in bulge height, surface area, and volume to be attributed to real physiological changes rather than differences in camera placement or perspective.
The bulge height data captures the most immediately visible aspect of the swelling: how far the ear protrudes relative to its normal surface. By extracting a robust peak height from the depth measurements each day, this signal reflects localized changes in ear geometry while reducing sensitivity to noise or single-point outliers. Over time, the height curve shows non-linear growth with small day-to-day fluctuations, mirroring real biological inflammation rather than smooth, idealized expansion. This makes bulge height a useful early indicator of progression, especially when changes are subtle and difficult to judge by eye.
The volume data provides a deeper and more clinically meaningful signal by integrating height changes across the affected area of the ear. Even small increases in bulge height can translate into disproportionately large increases in volume, making volumetric growth especially sensitive to worsening conditions. Tracking volume over time highlights acceleration phases that may not be obvious from height alone, helping distinguish between stable swelling and rapidly progressing pathology. In practice, this volumetric signal is what enables confident escalation decisions, as it captures the overall severity and momentum of the condition rather than a single geometric dimension.
By analyzing non-linear growth and acceleration in volume, an AI agent recommended immediate veterinary intervention on day 13; surgery was performed within hours, and Mr. Wiggles made a full recovery with a normal life expectancy.